Cakes & Desserts & Liqueurs
Various projects at Royal HaskoningDHV
Projects

Polar Vertex

Drawing of the week book
How to turn hundreds of whiteboard drawings in a great looking book.

Modern lamp
How to build your own great looking lamp with wood and easy to get materials.

VouwGrond - Paper craft soil layer visualization
Soil types at almost any location in the Netherlands using paper craft!

MySensors based sensors + dashboards

Simple DIY wireless button
How to make a BIG wireless button to trigger anything on your computer, laptop or Rasberry Pi.

DIY dressoir using wood

Candle powered Christmas pyramid
Building a Christmas pyramid (Weihnachtspyramide) with wood.

Construction of a Gloggomobil

Homebuild windmills

DIY Tetrapod plush

Climagon climate paper craft

Internet hardware furniture
Old code
Various games / projects at Deltares

Pompeii - Bike pump controlled game

Om de put (Around the pit)

Levee Patroller

Groen Eiland

Zand verdeler

Horsegame

CPT - game

Port of the Future (Corealis)
Serious game about ports of the future; nature based solutions.

Virtual Reality versions of experimental facilities

CIrcle
CIrcle a tool to support the analysis of domino effects of critical infrastructures.

Sustainable Delta Game
Game which combines 3d graphics, playing cards and a simulation model.
Older games
Augmented Reality / Graphics

Subsoil on a mobile device
My Master thesis: Visualizing and estimating the distance and depth of underground infrastructure.

Real-time visualization of water simulation
Turning calculated water flows into a real-time visualization.

RED - Motion captured animation

Open Data Sources for 3D Data Visualisation
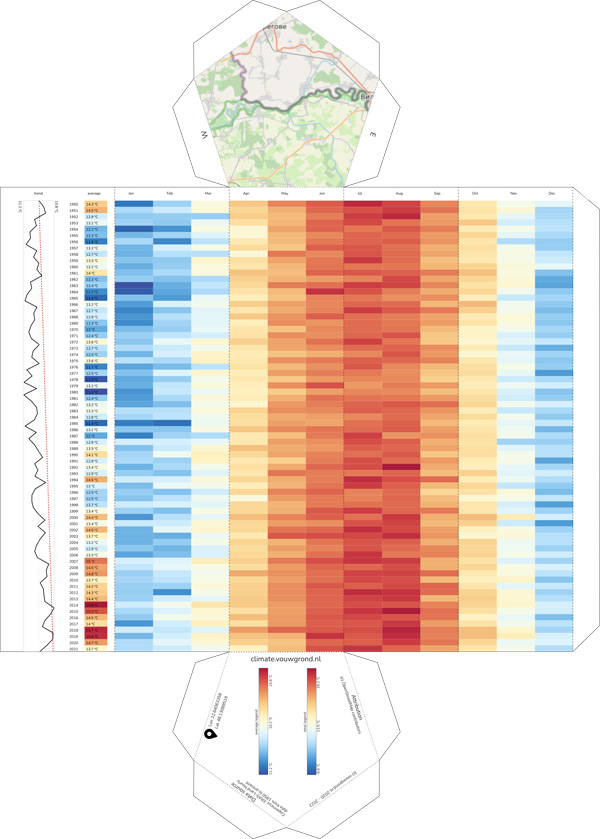
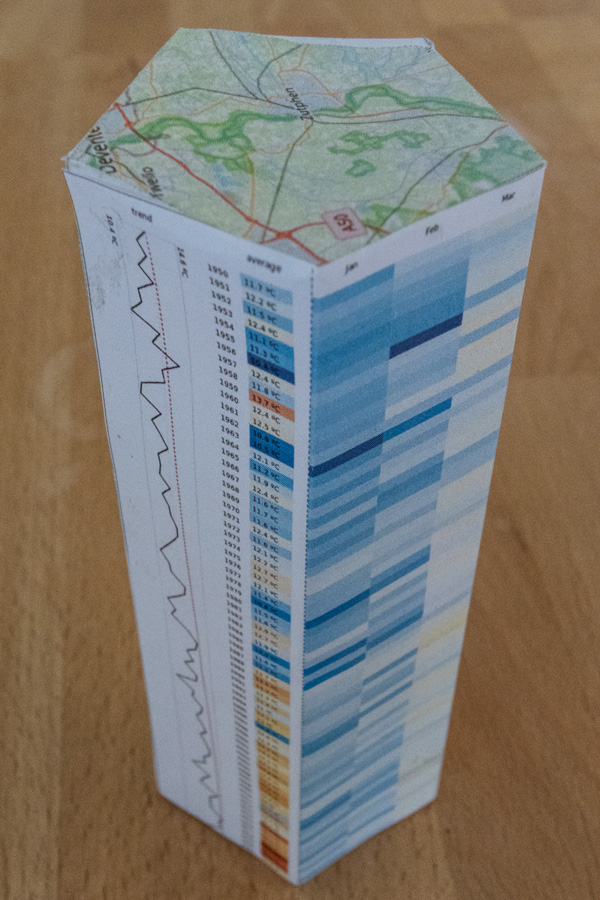
Visualization of Climate data using paper craft
Visualization of Climate data using paper craft
I really enjoy to occasionally build a tool to present data in a tangible way. Using paper craft is a great way to achieve this: the only thing you need is a printer, scissors and some glue.
So to try to visualize climate data from various satellite datasets, I build the website climate.vouwgrond.nl where you can build your own "Climagon" - a five sided pentagon with on four sides the different months, and one one side a trend line + annual average/cumulative values.
Alternatively you can also select a small summary card (which does not need any glue!) or a stripes representation of the data.
Be sure to visit the site and give it a try!